Posts

Showing posts from February, 2020

Rstudio code for MWP

You can read about this project at https://comfortablynumb-ers.blogspot.com/2020/02/win-probability-analysis-part-1-mean.html follow me at @kevgk2 on Twitter check out more rstudio guides and nflscrapR links at the bottom #legend: #pbp: play by play #WP: win probability #MWP: average win probability #WPE: win probability expected wins #pyth: pythagorean wins #install packages install.packages("nflscrapr") install.packages("tidyverse") install.packages("lubridate") install.packages("na.tools") install.packages("ggimage") #load libraries library(nflscrapR) library(tidyverse) library(lubridate) library(na.tools) library(ggimage) #determining the mean WP for a particular game #scrape games week_14_games <- scrape_game_ids(2019, weeks = 14) #pull play by play for specific game Gb_Was_PbP <- week_14_games %>%   filter(home_team == "GB") %>%   pull(game_id) %>%   scrape_json_play_by_pl...

Win Probability Analysis part 1: Mean Win Probability

Image
Win Probability Analysis part 1: Mean Win Probability Win Probability Analysis part 2: Win Probability Added Win Probability Analysis part 3: MWP Modified Check out the posts of R code after each release! Link at bottom, along with more nflscrapR and RStudio guides. Context: This project is about the Win Probability (WP) metric from the nflscrapR package in RStudio. This is a logistic regression that predicts win probability given some in game statistics. The data, collected by the nflscrapR, is from the NFL. All I did is average the WP calculation for every point in every game, and threw it on some plots. Did I invent Mean Win Probability? Not even close. Am I the first to consider it? Very unlikely. Despite that, I have not seen anything about it except here (somewhat): https://operations.nfl.com/stats-central/stats-articles/win-probability-models-for-every-nfl-team-in-2019/ Here is some literature about the WP calculations: https://arxiv.org/pdf/1802.00998.pdf https...

Using the Excel Nonlinear Solver to Optimize Skill Trees with Borderlands 3 Example

Image
Using the Excel Nonlinear Solver to Optimize Skill Trees with Borderlands 3 Example I used Borderlands 3 for an example because it is an easy one to create and understand. There are some complex skill trees out there, and this one is restricted to 18 decision variables with the only contingencies being previous skills. This solution may not be optimized for your specific play style of Borderlands 3, but it is optimized at one very specific thing (for the most part, as this is not a perfect recreation of the skill tree). Every numerical solver for an optimization problem needs three things: an objective function, decision variables, and constraints. I will describe all three in an order that makes the most sense with my excel file for reference at this download link https://drive.google.com/open?id=1nSft-2OV0lfmIXcfaenflDBmUigUM2Ja Objective Function: This is a specific function of the decision variables to be either minimized or maximized. For this game, I was using a specific...

2, 3, 5, 7, 11, 13, 17, 19, 23, 29, 31, 37, 41, 43, 47, 53, 59, 61, 67, 71, 73, 79, 83, 89, 97

Image
Sums of Primes in R I was interested in the Weak Goldbach Conjecture: Any odd integer greater than 5 can be expressed as a sum of 3 prime numbers. Namely some very interesting graphs are out there about the actual number of combinations of primes that yield odd numbers. Now, this exercise was made hastily but it gives a good foundation of further analysis. The Weak Goldbach Conjecture specifies odd integers, but I used any number that can be expressed as a sum of primes (within a range). One thing to note, even numbers that can be expressed as a sum of three primes must have 2 as one of the primes. Simply: odd plus odd is even, add a third odd and you yield and odd number. 2 is the only even prime. Therefore it probably isn't hard to find an even integer that cannot be expressed as a sum of three primes. Here is a generated histogram showing bins of integers and the numbers of ways they could be expressed as a sum of three primes *from our sample*. Interestingly, ...

Distribution of Random Vector Length

Image
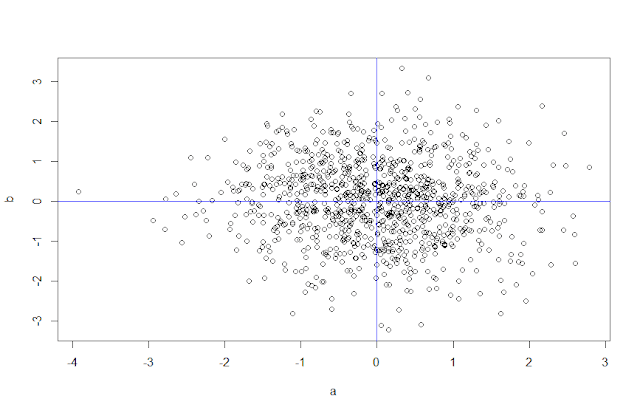
Distribution of Random Vector Length In a bout of boredom, I took upon a small R project, as one does. In this project, the main goal was to determine the distribution of a Pythagorean expression, that is Sqrt(A^2 + B^2) where A and B are standard normals. Some practical application exists for this I'm sure, but at least geometrically it corresponds to the length of a random vector in an AB space. Here is those values, n=1000 n=10000 Without actually doing the transformations by hand, it isn't hard with some background knowledge to see a standard normal squared is a chi-square, the sum of chi-squares is a gamma, and the square root of a gamma is a particular gamma. A helpful R package lets me sample for gamma parameters and see how close my sampled graphs match. A smoothed density of sampled distribution over a gamma with the sampled parameters show how close a gamma can fit with our sampled data. n=10000 and 1000 respectively Shouldn't be a surprise t...